How WiseData Lets You Analyze Layoffs Data with only English
Data Analysis with tech layoffs data with only English. You can gain 2X productivity this way and get to insights faster.
David @ WiseData · July 3, 2023
Introduction
Layoffs are a common and unfortunate reality for many businesses, especially during times of crisis or economic downturn. However, layoffs can also provide valuable insights into the health and performance of a company, as well as the trends and challenges in the industry or market. In this blog post, we will show you how to use WiseData to analyze tech layoffs data and generate meaningful charts and graphs on Kaggle/Jupyter Notebook/Google Colab.
You can download the Jupyter notebook from HERE.
What is WiseData?
WiseData is a Python library that lets you transform and visualize data with natural language. It uses ChatGPT and cutting-edge natural language processing (NLP) and natural language understanding (NLU) techniques to understand your queries and generate chart that match your intent. You can use WiseData to transform data and create many kinds of charts, such as bar charts, line charts, scatter plots, histograms, box plots, and more.
About the Data
The data used in this blog is from https://www.kaggle.com/datasets/theakhilb/layoffs-data-2022
Each row of the data is a layoff event, a company may layoff people multiple times. The data availability is from when COVID-19 was declared as a pandemic i.e. 11 March 2020 to end of April 2023.
Installing WiseData
1. Obtain an API Key
To use WiseData, you need to obtain an API Key. Simply visit https://www.wisedata.app, fill out your email address. And the API Key used for Python package will be delivered to your email.
2. Installation
Using WiseData is super easy and fun. You need to install the library using pip.
We will install additional libraries needed as well.
pip install wisedata
pip install pandas numpy matplotlib seaborn
3. Instantiation
Then you can import WiseData and instantiate the WiseData class with your API key:
from wisedata import WiseData

# TODO: Copy your API key which you've received in your email here
wd = WiseData(api_key="YOUR_API_KEY")
4. Read Layoff data
Download data from HERE, save it to where your notebook is located in, and name it as layoffs.csv.
Let’s load the data.
import pandas as pd

df = pd.read_csv("layoffs.csv", parse_dates=["date"])
And now you are ready to do data analysis!
Top 5 country with largest layoffs
It is important to understand which countries was impacted the most by layoffs. Let’s ask WiseData to transform the data and draw chart for this.
top_country = wd.transform("List top 5 country with the largest layoffs aggregate by country.", {
    "df": df
})

wd.viz("Draw bar graph ordered by largest layoffs", {
    "top_country": top_country
})
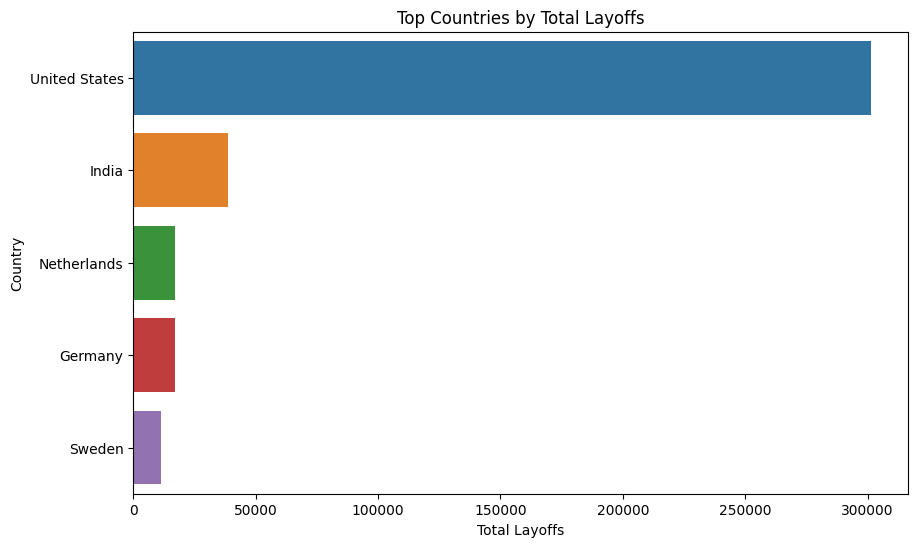
- United States leads the list with highest number of layoffs with almost 300,000 employees.
- India follows next with 40,000 employees.
Top 10 companies with the largest layoffs
Which companies had largest layoffs?
top_10 = wd.transform("List top 10 companies with the largest layoffs aggregate by company.", {
    "df": df
})

wd.viz("Draw bar graph ordered by largest layoffs", {
    "top_10": top_10
})
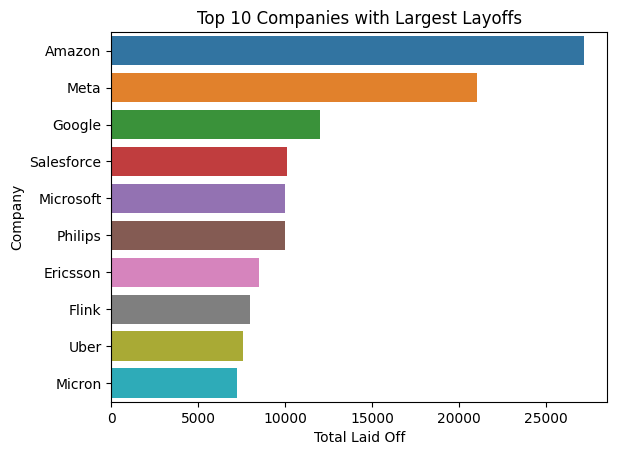
- Amazon leads the list with the highest number of layoffs, totalling 27,150 employees.
- Meta and Google follow, with 21,000 and 12,000 laid-off employees, respectively.
- Overall, the top 10 companies with the largest layoffs encompass a variety of industries, including technology, retail, and transportation.
- Twitter did not make it to the list 🙂
Industries that had the biggest impact
Of all the industries, which had the most impact?
top_10_industries = wd.transform("List top 10 industries with the largest layoffs aggregate by industry.", {
    "df": df
})

wd.viz("Draw bar graph ordered by largest layoffs", {
    "top_10_industries": top_10_industries
})
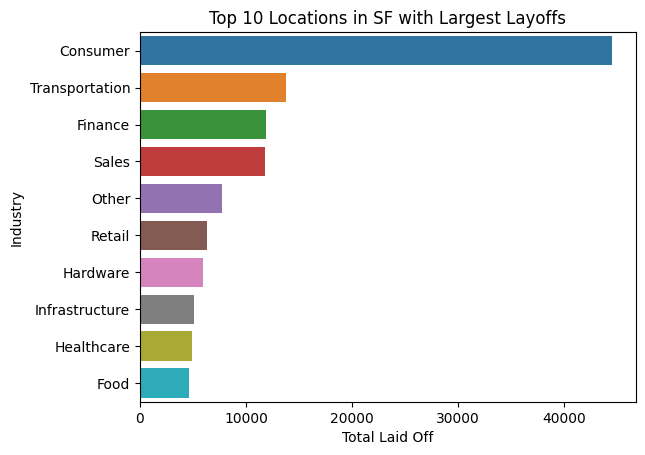
- Consumer and Retail industries have the most significant impact, with total layoffs of 39,329 and 37,792, respectively.
- Transportation (31,517) and Food (24,469) sectors follow closely, together accounting for over 55,000 layoffs.
- Finance (22,884) and Real Estate (14,541) industries also show substantial impact, while Healthcare, Sales, and Crypto have comparatively lesser effects.
Cities that had the biggest impact
top_10_location = wd.transform("List top 10 location with the largest layoffs aggregate by location.", {
    "df": df
})

wd.viz("Draw bar graph ordered by largest layoffs", {
    "top_10_location": top_10_location
})
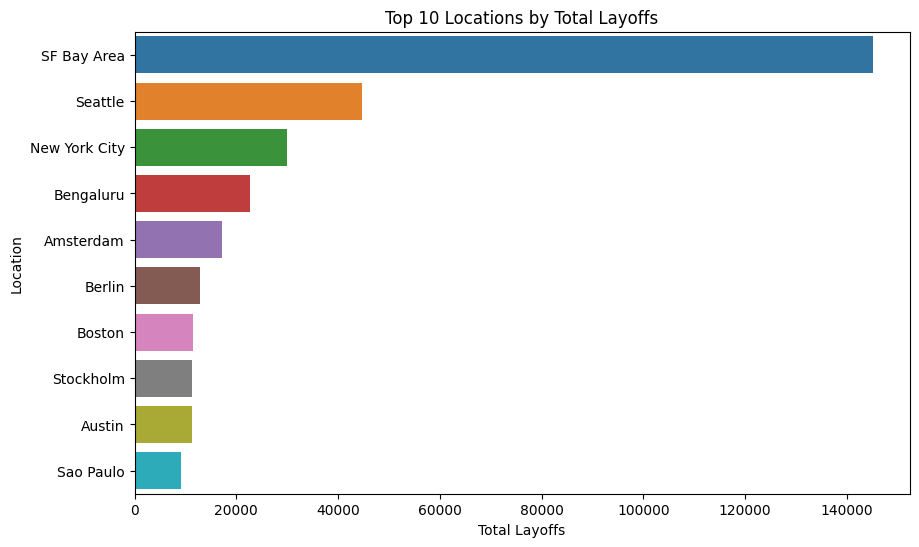 • SF Bay Area has the highest number of total laid off employees with 145,051, followed by Seattle at 44,741 and New York City at 29,976.
When did most layoffs happen?
num_layoff_by_month = wd.transform("Total laid off each month", {
    "df": df
})

wd.viz("Draw bar graph ordered by month. wide chart. bars have same colour", {
    "num_layoff_by_month": num_layoff_by_month
})
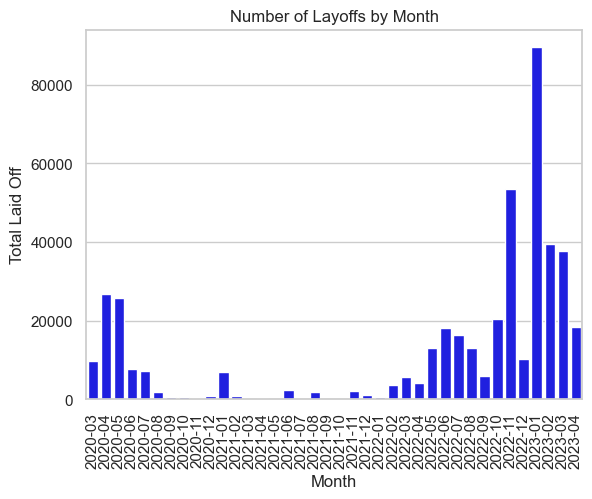
- The highest number of layoffs occurred in January 2023 and number of lay-offs had decreased.
- Number of layoffs happened between Nov 2022 to March 2023 are higher than when COVID-19 started!
What are the benefits of WiseData?
WiseData has many benefits for data transformation and visualization. Some of them are:
- It saves you time and effort by automating the chart creation process, and gain insights faster.
- It allows you to express your data transformation and visualization needs in natural language.
- It allows you to write more concise and readable code. People who are reading code can interpret the visualization easily.
Conclusion
WiseData is a powerful and innovative tool for data transformation and visualization with natural language. It can help you create amazing and interactive charts with just a few words. It can also help you learn more about your data and communicate your findings effectively.
If you're looking for a way to streamline your data analysis workflow, give WiseData a try @ https://www.wisedata.app!
Happy visualizing! 📊