Exploratory Data Analysis of Netflix Titles
Let’s use English only to do Exploratory Data Analysis of titles released by Netflix. You can gain 2X productivity this way and get to insights faster.
David @ WiseData · July 5, 2023
Introduction
Netflix is one of the most popular streaming platforms in the world, with over 200 million subscribers and thousands of titles in its catalog. In this blog post, we will perform exploratory data analysis on Netflix titles using only English with help of WiseData on Jupyter Notebook/Google Colab/Kaggle.
You can download the Jupyter notebook from HERE.
What is WiseData?
WiseData is a Python library that lets you transform and visualize data with natural language. It uses ChatGPT and cutting-edge natural language processing (NLP) and natural language understanding (NLU) techniques to understand your queries and generate chart that match your intent. You can use WiseData to transform data and create many kinds of charts, such as bar charts, line charts, scatter plots, histograms, box plots, and more.
About the Data
The data used in this blog is from https://www.kaggle.com/datasets/shivamb/netflix-shows
This dataset consists of listings of all the movies and tv shows available on Netflix, along with details such as - cast, directors, ratings, release year, duration, etc. There are total of 7787 listings.
Installing WiseData
1. Obtain an API Key
To use WiseData, you need to obtain an API Key. Simply visit https://www.wisedata.app/, fill out your email address. And the API Key used for Python package will be delivered to your email.
2. Installation
Using WiseData is super easy and fun. You need to install the library using pip.
We will install additional libraries needed as well.
pip install wisedata
pip install pandas numpy matplotlib seaborn
3. Instantiation
Then you can import WiseData and instantiate the WiseData class with your API key:
from wisedata import WiseData

# TODO: Copy your API key which you've received in your email here
wd = WiseData(api_key="YOUR_API_KEY")
4. Read Netflix data
Download data from HERE, save it to where your notebook is located in, and name it as netflix_titles.csv.
Let’s load the data.
import pandas as pd

df = pd.read_csv("netflix_titles.csv", parse_dates=["date_added"])
Cleaning Data
The data is not clean due to:
- There are data that container null value
- country column could have multiple countries
- date_added contains leading spaces
missing_vals = wd.transform("Percentage of null values for each column", { "df": df })
multi_country = wd.transform("Return rows which contain comma in country column.", { "df": df })

print(missing_vals)
print("Number of titles which released to multiple countries: " + str(multi_country.shape[0]))
Executing this code will print out following:
          column  percentage_null
0        show_id         0.000000
1           type         0.000000
2          title         0.000000
3       director        30.679337
4           cast         9.220496
5        country         6.510851
6     date_added         0.128419
7   release_year         0.000000
8         rating         0.089893
9       duration         0.000000
10     listed_in         0.000000
11   description         0.000000

Number of titles which released to multiple countries: 1153
Some columns contain null values. And some titles have multiple countries listed. For simplicity purpose, let’s remove titles with multiple countries and fill null values with some data.
cleaned_df = wd.transform("Strip leading and trailing whitespates in date_added column", { "df": df })
cleaned_df = wd.transform("Replace country with null with most common country in dataset", { "cleaned_df": cleaned_df })
cleaned_df = wd.transform("Replace director and cast with null with 'No Data'", { "cleaned_df": cleaned_df })
cleaned_df = wd.transform("Remove rows where any value is null. And drop duplicates", { "cleaned_df": cleaned_df })
cleaned_df = wd.transform("Remove rows where country column contains comma.", { "cleaned_df": cleaned_df })
cleaned_df = wd.transform("Convert date_added to datetime format", { "cleaned_df": cleaned_df })
cleaned_df = wd.transform("Add following new columns: month_added, month_added_name, year_added", { "cleaned_df": cleaned_df })
Let’s check again on null values and and how many rows of data left.
print(wd.transform("Percentage of null values for each column", { "cleaned_df": cleaned_df }))
print(wd.transform("Count of rows in dataframe", { "cleaned_df": cleaned_df }))
Executing this code will print out following:
              column  percentage_null
0            show_id              0.0
1               type              0.0
2              title              0.0
3           director              0.0
4               cast              0.0
5            country              0.0
6         date_added              0.0
7       release_year              0.0
8             rating              0.0
9           duration              0.0
10         listed_in              0.0
11       description              0.0
12       month_added              0.0
13  month_added_name              0.0
14        year_added              0.0
   count
0   6617
Great! null values are gone now and we can start to analyze data.
Countries with most Netflix titles
What if we look at number of titles by country? USA will probably dominate.
wd.viz("Top 10 countries with most titles. Use color palette 'Reds'", { "cleaned_df": cleaned_df })
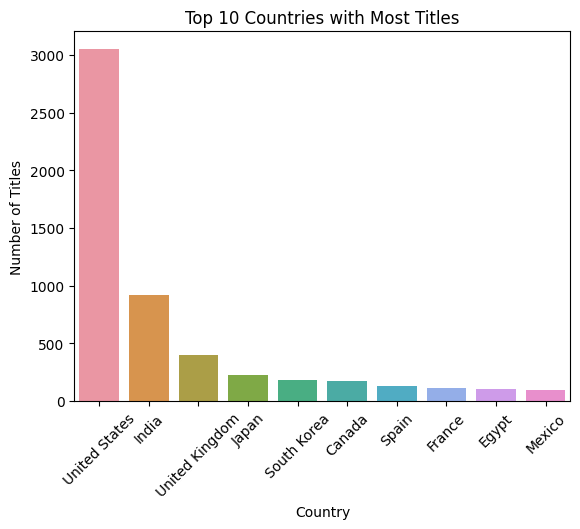
As predicted, the USA dominates with India behind USA.
Movies vs TV Shows
Let’s take a look at number of movies vs TV shows that Netflix had released.
wd.viz("Graph of percentage for each title type. Display actual percentage on bar. Use color palette 'Reds'", { "cleaned_df": cleaned_df })
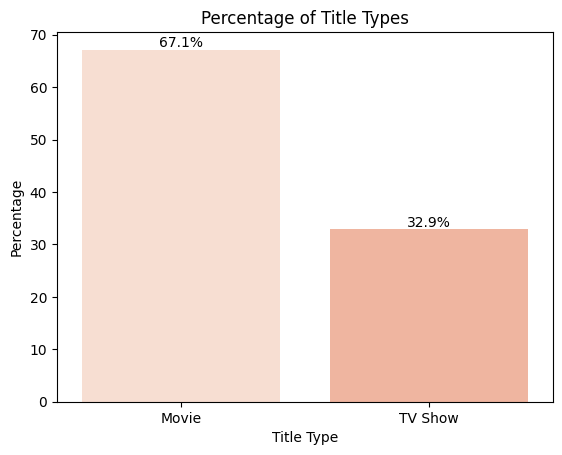
We now know there are much more movies than TV shows on Netflix (which surprises me!).
Which country makes most movies compared to TV shows?
top_10_country = wd.transform("Top 10 countries with most title", { "cleaned_df": cleaned_df })
top_10_country_str = top_10_country["country"].to_csv(header=None, index=False).strip('\n').split('\n')
top_10_movie_ratio = wd.transform(f"Rows with following country: {top_10_country_str}", { "cleaned_df": cleaned_df })
top_10_movie_ratio = wd.transform("Calculate count where type is movie / total count for each country", { "top_10_movie_ratio": top_10_movie_ratio})

wd.viz("Movie ratio in descending order. Use color palette 'Reds'.", { "top_10_movie_ratio": top_10_movie_ratio })
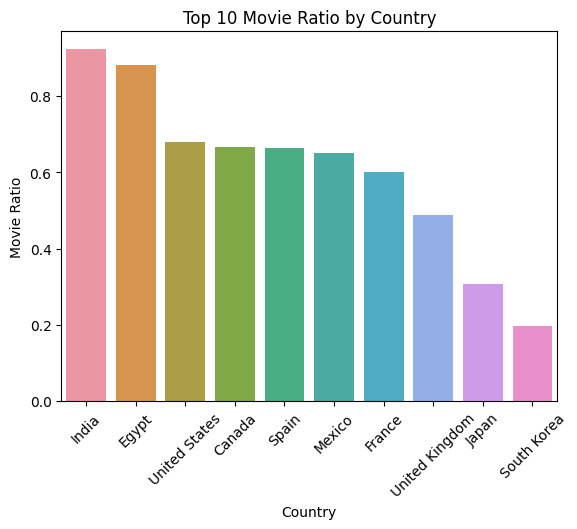 It is really interesting to see how the split of TV Shows and Movies varies by country.
South Korea is dominated by TV Shows - why is this? I am a huge fan of South Korean cinema so I know they have a great movie selection.
Equally, India is dominated by Movies. I think this might be due to Bollywood.
Ratings
Let's briefly check out how ratings are distributed.
wd.viz("Number of movies for each rating with descending order. Use color palette 'Reds'. axis do not overlap", { "cleaned_df": cleaned_df })
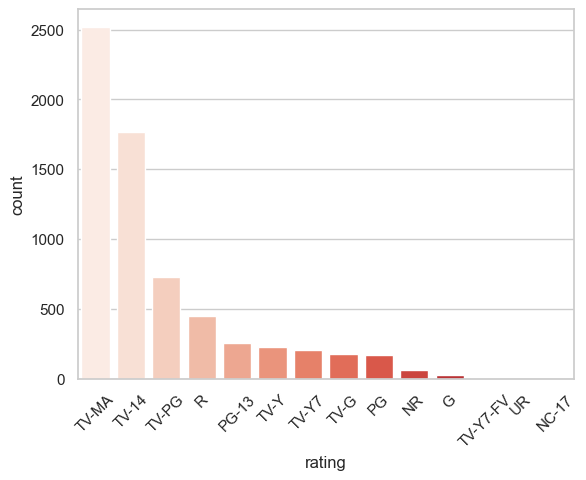
TV-MA and TV-14 are dominating Netflix!
How does ratings distribute across countries?
rating_vs_country = wd.transform("Retrieve titles with type = TV Show", { "cleaned_df": cleaned_df })
rating_vs_country = wd.transform(f"Percentage of rating for each country in {top_10_country_str}", { "rating_vs_country": rating_vs_country })
rating_vs_country = wd.transform("Pivot table of rating vs country with percentage as value. Fill null with 0", { "rating_vs_country": rating_vs_country })

wd.viz("A heat map of rating vs country. Use color pallete 'Reds'", { "rating_vs_country": rating_vs_country} )
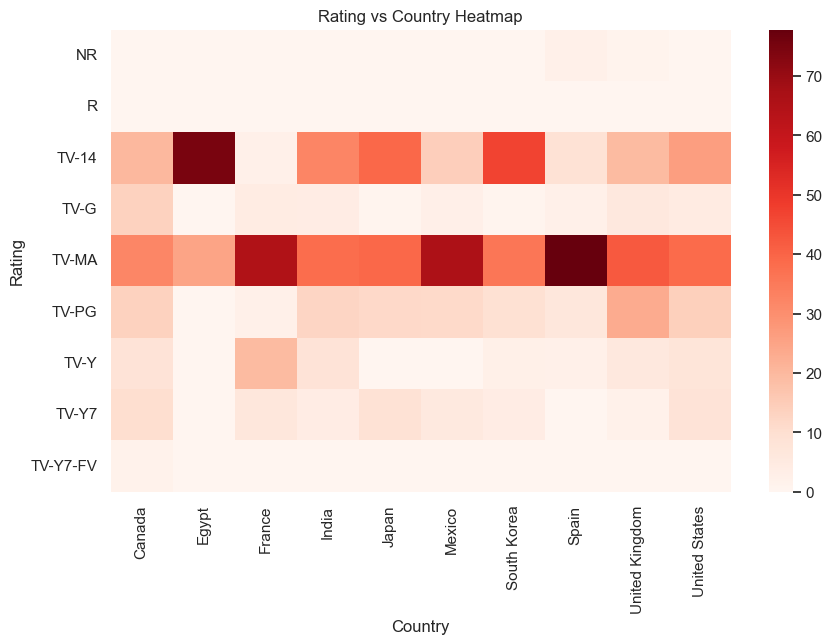
For Spain, TV-MA is dominating the titles! Surprisingly for Egypt TV-14 rating is dominating.
Release dates
Netflix went global in 2016. How many titles have been release throughout years?
num_movies_cumulative = wd.transform("Cumulative number of titles each year for each type", { "cleaned_df": cleaned_df })

wd.viz("Number of cumulative count for each year by type. Line Chart. Use color palette 'Reds'. axis do not overlap", { "num_movies_cumulative": num_movies_cumulative })
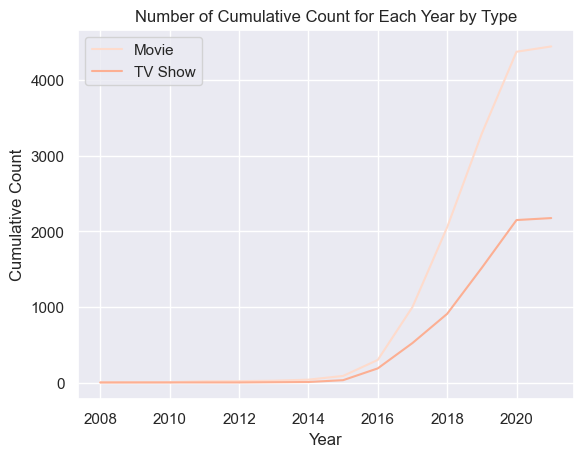
As predicted, number of titles released by Netflix has increased significantly after 2016.
Are there any time Netflix likes to release titles?
num_movies_cumulative_month = wd.transform("Total number of titles each month for each type. Include month_added and month_added_name column. flatten data", { "cleaned_df": cleaned_df })

wd.viz("Total titles for each month_added for each type. Line Chart. Use color palette 'Reds'. axis do not overlap", { "num_movies_cumulative_month": num_movies_cumulative_month })
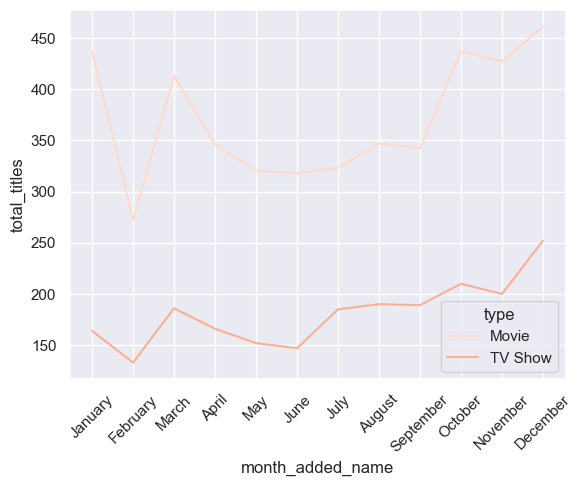
Towards the end of the year, Netflix usually releases more titles. Could it be due to holiday season in December?
Conclusion
WiseData has many benefits for data transformation and visualization. Some of them are:
- It saves you time and effort by automating the chart creation process, and gain insights faster.
- It allows you to express your transformation and visualization needs in natural language.
- It allows you to write more concise and readable code. People who are reading code can interpret the visualization easily.
If you're looking for a way to streamline your data analysis workflow, give WiseData a try @ https://www.wisedata.app!
Happy visualizing! 📊